Solution · Agribusiness
The season in numbers, field by field
one view of productivity, cost, and margin by field, crop, and season
The challenge
What isn't measured becomes a loss at season's end
Productivity, cost, and margin are scattered across notebooks, spreadsheets, and systems that don't talk to each other. The gaps we see most:
You only learn productivity at season's end
By the time the number closes, the season is already over and there's no reacting. Without tracking productivity by field across the cycle, the correction always arrives too late.
Cost per field is a mystery
Inputs, machine-hours, and labor all go into the same pot. Without cost per field and per acre, it's impossible to know where the farm earns and where it loses money.
Reports are born and die in a spreadsheet
Every month someone copies data by hand into a spreadsheet no one trusts. It's manual work, stale information, and a risk of error that undermines the decision.
No way to compare seasons and crops
Was it better than last year? Which crop returned the most margin per acre? Without comparisons across seasons and crops, the next planting decision becomes a bet.
How we implement
From the field's data to the season's decision
We build the panels on the base of the agribusiness ERP we deliver, with end-to-end production management as a reliable data source.
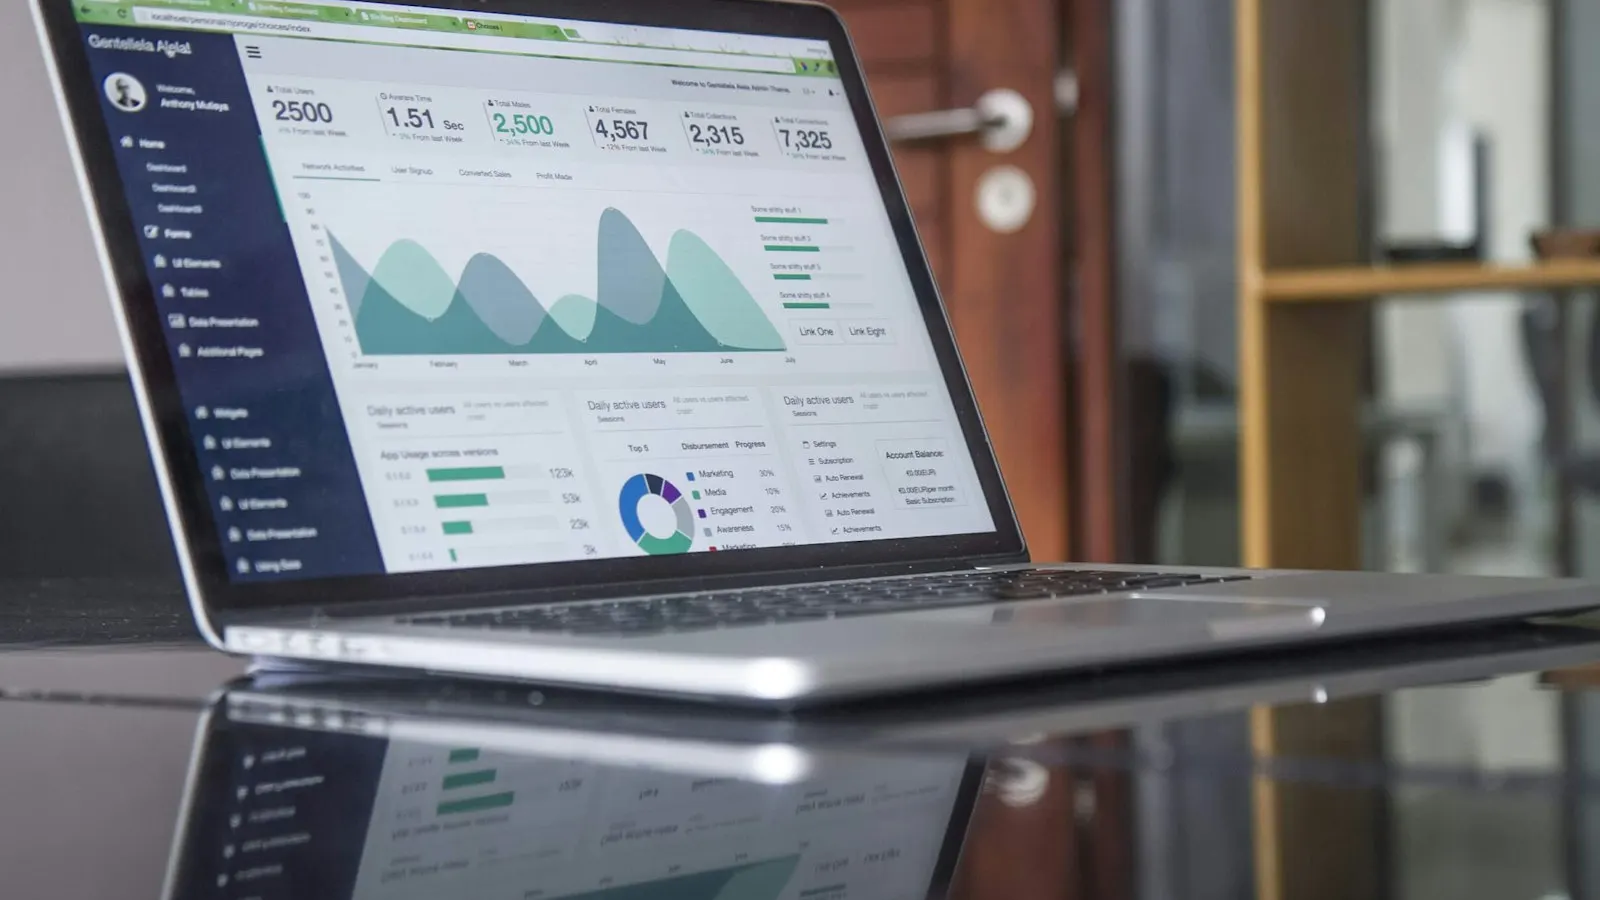
Productivity by field, crop, and season
A single panel showing yield by field, by crop, and by season, always up to date. Built on the data base of the agribusiness ERP we deliver, with end-to-end production management from field to finance.
Cost and margin by field and per acre
Inputs, machine-hours, and labor allocated to the right field, with cost per acre and margin in view. You see where the farm earns and where it loses money, with numbers, not guesswork.

Season and crop comparisons
Compare this season with previous ones and one crop against another, side by side. Decisions on planting, inputs, and acreage gain history and evidence behind them.
Deviation alerts and access in the field
When an indicator drifts off target, the alert arrives before it becomes a loss. All in the cloud and on the phone, to track productivity, cost, and margin wherever you are.
Technologies
Technologies & partners
 Power BI
.svg) Node.js
Node.js Python
.svg) PostgreSQL
PostgreSQL AWSPower BINode.jsPythonPostgreSQLAWSPower BINode.jsPythonPostgreSQLAWS
Common questions about productivity dashboards
Let's turn your season into numbers that decide
Bring the reality of your farm. You'll leave the conversation with a clear path to seeing productivity, cost, and margin by field, crop, and season.