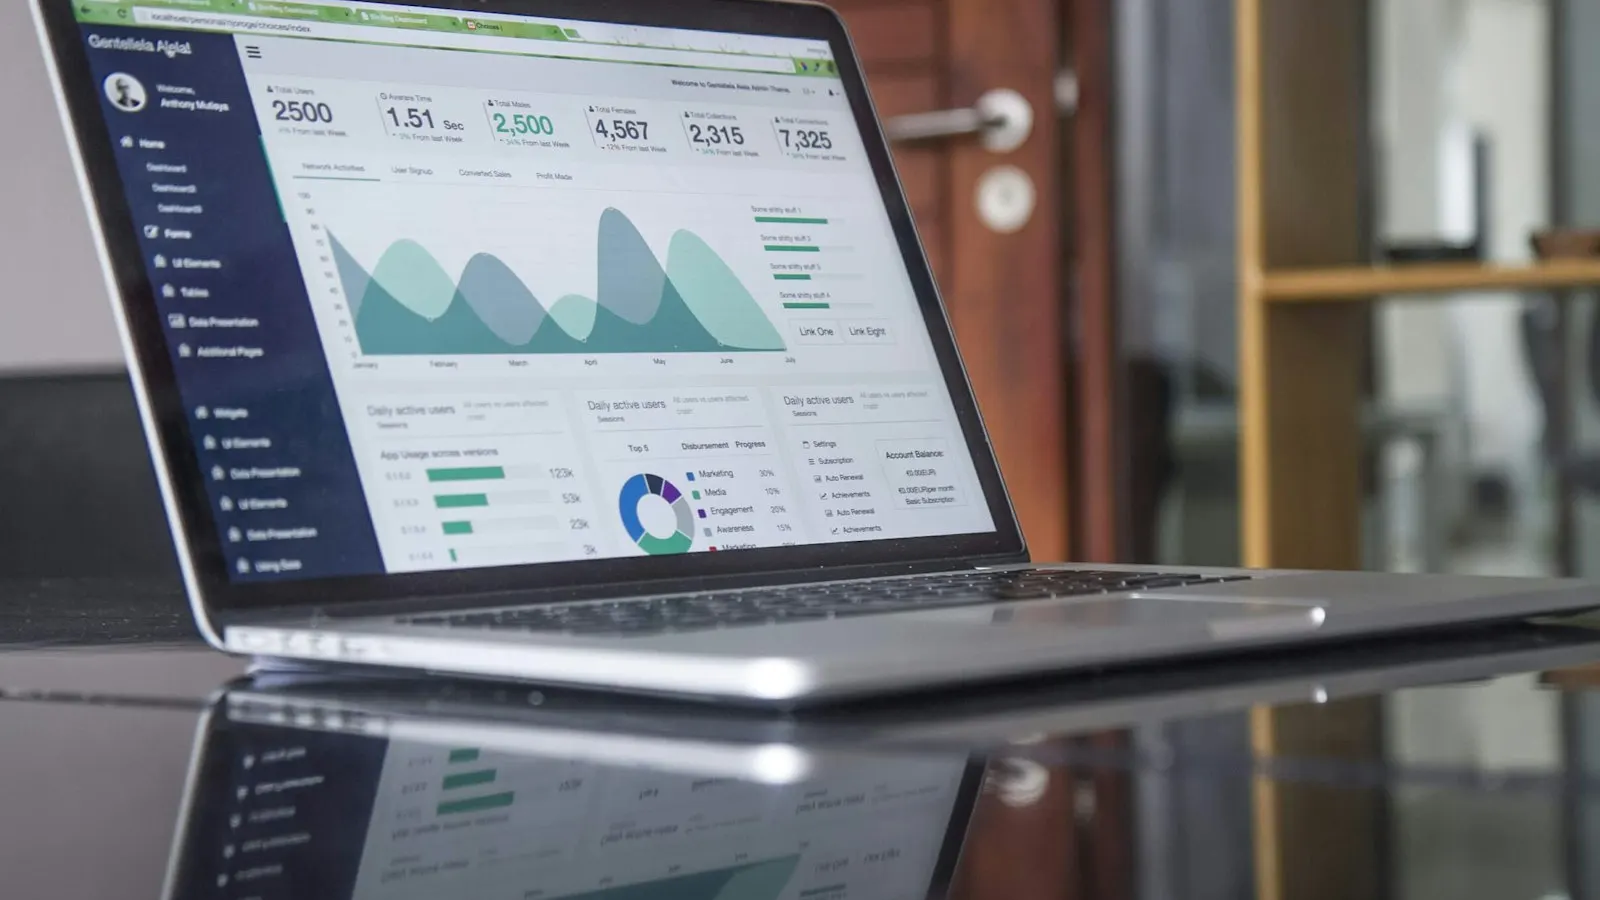
Operational BI and Analytics · Telecom Network, customer, and churn on a single dashboard
one unified view of network, customer, and operations to decide with data and predict churn
The challenge
Scattered data is a decision made in the dark
Network, customer, and operations in separate silos hide what matters: who's about to churn and where the network is failing. The gaps we see most:
Network, customer, and operations in silos
Each team looks at its own dashboard. Without a common foundation, no one sees how network quality affects the customer and the revenue, and decisions turn into guesswork.
Churn spotted too late
By the time a cancellation shows up in the report, the customer is already gone. Without an early signal of who's about to leave, all that's left is reaction, not prevention.
Network quality with no visibility
Outages, slowdowns, and QoS degradation only become a topic when the customer complains. Without network metrics on a dashboard, the problem grows silently.
Decisions with no data nearby
Loose spreadsheets, manual exports, and numbers that don't match across teams. Leadership decides in the dark because the right data doesn't arrive in time.
How we implement
From raw data to decisions backed by evidence
We bring to telecom BI the data engineering and machine learning patterns we use to turn scattered data into decisions.
Network, customer, and operations on one foundation
Every team works from the same numbers. We consolidate network data, the customer base, and operations into a single data lake, with reliable metrics: one source of truth that replaces loose spreadsheets and reports that never match.

Churn prediction with machine learning
Retention acts on the right customer, at the right time, instead of chasing losses. Models flag who's about to cancel before the request arrives, with the signals that explain the risk.

Network quality (QoS) under watch
The operation sees the problem before the customer feels it and prioritizes where it hurts most, with availability, latency, and network-degradation metrics on a dashboard and alerts when something falls out of pattern.

Executive dashboards that guide the decision
Network, customer, and revenue panels in a single view, with segmentation by region, plan, and channel. Leadership decides with evidence, not guesswork, and every team speaks the same language of numbers.
Technologies
Technologies & partners
 Python
 Power BI
 AWS
Verified by our clients, not by us
37 verified reviews on Clutch with a 4.8 average rating. Clutch verifies every reviewer and publishes the full text, including the critical parts.
Common questions about BI and analytics
Let's turn your data into decisions
Bring your BI and analytics challenge in telecom. You'll leave the conversation with a clear technical path, from consolidating the data to predicting churn.